 Java VisualVM was released more than year and a half ago, but its still worth blogging since most people don’t know about it.
VisualVM is an open source tool for monitoring and profiling your Java applications. VisualVM is now integrated with JDK 6 update 7 release and also available as a stand-alone setup. Java 7 plans to integrate next version 1.2.
So, from now on you need not pay a hefty price for licensing third party profilers. In this article we’ll walk through the features of VisualVM and see how it is different from commercial profiling tools.
Let’s see what the entire buzz is all about.
It provides a nice graphical user interface for monitoring and troubleshooting Java applications and integrates several troubleshooting features introduced in JDK 5 and 6 as command-line utilities into this single GUI tool.
I liked their screen-cast that shows VisualVM in action. It should help you get started:
VisualVM, Java’s own monitoring, profiling and performance benchmarking tool.
Even though many monitoring and diagnostics features are enhanced and introduced in Java 6, still it has been lacking an out-of-the-box bundling of a convincing visual Java application monitoring or profiling tool, until the most recent JDK6 Update 7.
You can find VisualVM under the bin directory of your JDK6u7 installation. Just double click the exe and its there the VisualVM.

The main window of VisualVM opens when you launch the application. By default, the Applications window is displayed in the left pane of the main window. The Applications window enables you to quickly see the Java applications running on local and remote JVMs. The Applications window is the primary entry point for viewing further details about a particular application. Right-clicking an application node opens the popup menu where you can choose to open the main application tab or take thread or heap dumps.

If you have used the Netbeans platform, you can easily recognize that VisualVM is also built upon the Netbeans Platform.
Now that you have VisualVM running you can do several things like
1) Create and visually view heap Dumps
2) Profile memory usage
3) Profile CPU Usage
4) Profile Threads
In the past you had to use one or more commercial tools to get the above tasks done. But with VisualVM you have one integrated tool that can do all the above.
VisualVM allows you to do much more than traditional monitoring and profiling.
1) You can take a snap shot of the thread status and heap status and save them for analyzing offline.
2) You can monitor multiple applications both local and remote from a single VisualVM instance. You can also take simultaneous thread dumps of multiple applications for analyzing distributed dead locks.
3) No need for complex configuration. Traditional memory profilers either require you to run your applications in a special, modified JVM or start your applications with the profiler agent. But with VisualVM, you start your java applications normally and VisualVM automatically lists the Java applications running on your local machine.
4) VisualVM is extensible. Yes we love plugins, and since VisualVM is built on the NetBeans Platform, its architecture is modular and easy to extend with plugins. There are several plugins already available for VisualVM like:- MBeans Browser, JConsole Plugins Container, VisualVM Extensions, Visual GC Plugin, GlassFish Plugin, BTrace Plugin, TDA Plugin.
VisualVM, the lightweight profiler and troubleshooting tool is available to build as part of IcedTea6 for 32 and 64 bit arch ![]() . The whole thing builds from source — NetBeans platform7 and profiler2 (visualvm_preview2), and finally VisualVM 1.0. A binary launcher
. The whole thing builds from source — NetBeans platform7 and profiler2 (visualvm_preview2), and finally VisualVM 1.0. A binary launcher `jvisualvm` is put in the ${JDK}/bin directory along with the rest of the tools.
Here are some VisualVM Screenshots:
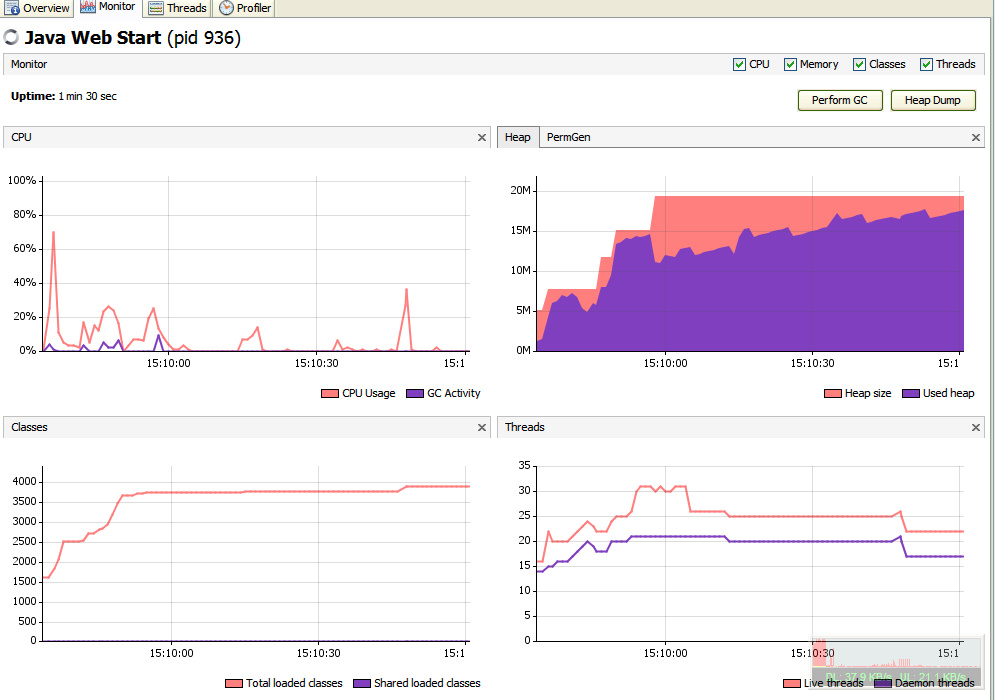
Screenshot1: Benchmark CPU usage and Heap memory usage during execution of a JavaFX web gallery.
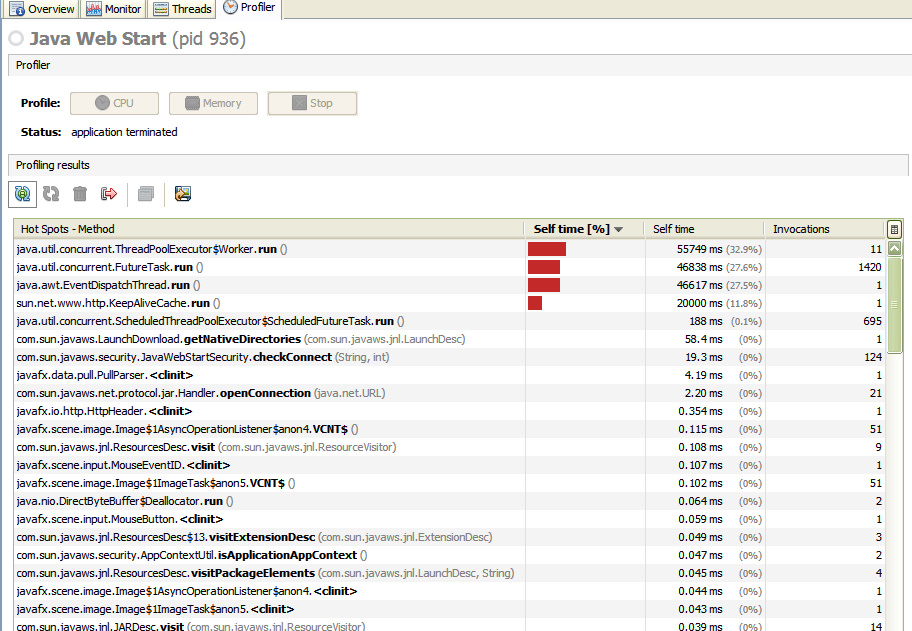
Screenshot 2: Method, class Execution Profiler
This tool has a lot of potential. A while back I used to benchmark JavaFX. And today, it’s my first choice for benchmarking any application. Finding memory leaks, performance bottlenecks, Heap usage optimizations, all can be done graphically, goodbye to other tools.
For many situations, this tool can prove out to be a great reverse-engineering tool at Runtime. For instance when you have a jar, war, ear running and it is misbehaving and there is no traces in the logs, visualVM can help. This tool will let you know what part of code was executed that caused peaks in CPU/memory usage, or potential memory hogs in your application.
Threads tab, like many other debuggers, will give you complete info on all the running threads: Time, state, id, etc.
See also the Java VisualVM User Guide:
http://java.sun.com/javase/6/docs/technotes/guides/visualvm/index.html
VisualVM project page:
https://visualvm.dev.java.net/gettingstarted.html
Do you know any Open source tool that can outperform VisualVM in speed and features? Let me Know.
Follow me on Twitter, Join Facebook Page or Subscribe to RSS for more Tech Updates.
loading...
loading...
Check on how to use visual vm through ssh proxy in production systems http://webspherehelp.blogspot.com/2009/07/visualvm-remote-application-monitoring.html
loading...
loading...
Its a shame its so hard to tunnel VisualVM over a ssh connection (due to the fact that it needs to open multiple connections on hard-to-predict ports).
loading...
loading...
Perhaps not Open Source but Oracle offers JRockit Mission Control (http://www.oracle.com/technology/products/jrock…) free for evaluation and development.
loading...
loading...
I've also used Visual VM successfully in the past, but it doesn't work for all applications. For example, we just tried to use Visual VM with a Seam web app, but when Visual VM rewrote the classes at runtime, it did so in a way that caused the app to start throwing errors. We tried Yourkit instead, and didn't see the issue. (I have no relation to yourkit–we're about halfway through our 15 day trial of their software).
loading...
loading...
Assuming you are also interested in production usage which is not possible with the above mentions tools you should really try out JXInsight. Hundreds of times faster and more extensible. And Seam aware.
http://blog.jinspired.com/?p=738
loading...
loading...
I've just tried it, new VisualVM 1.2 is about 3 times faster than JXInsight and the sampling no more breaks the application! Perfectly usable in production and is free.
loading...
loading...
Peter what exactly are you talking about. 3 times faster. You do not even have access to JXInsight unless you are talking about a version 2 years old and referring to tracing. JXInsight's Probes technology has an overhead of 1 ns compared to Visual VM with 600 ns per execution profiled method. 600 times faster. So you are saying that Visual VM has from 1.1 to 1.2 reduced its overhead by 1800x.
loading...
loading...
William you probably even didn't try the new version before saying the numbers. VisualVM 1.2 seems to have introduced a sampling profiler (currently only a test build is available) which doesn't require any probes etc. and has no overhead. I'm saying it's 3 times faster than JXInsight, just go and try it yourself – you can be sure you'll have access to it since it's free.
BTW why do you think I don't have access to the latest JXInsight? Are you talking about some super-secret relase which do you use for comparing with other tools?
loading...
loading...
is it the same thing as profiler bundle in netbean ?
loading...
loading...
Sadly, but it doesn't work with IBM JDK 🙁
loading...
loading...
I think a good profiler needs to be able to (almost) automatically detect deadlocks and memory leaks. For the first JVisualVM does an excellent job (as does the Eclipse debugger when you show monitor status).
I already used it to find out why one of our unit tests failed; turned out to be a deadlock in ActiveMQ which (I think…) only shows up when it closes so it's of low concern. It's a relief to find out it was not in our own code…
I have no experience in using it for finding memory leaks, might be hard. The Eclipse profiler plugin did a great job for me on a memory leak before by showing why a certain object did not get garbage collected.
Such tools can be great time savers for these kind of hard to localize bugs.
loading...
loading...
I think this is a great article because it contain very useful information.Thanks guy's for sharing this valuable information. keep it up…..
loading...
loading...
a good news
loading...
loading...
a good news
loading...
loading...
Great post. I have been researching Java Profiling tools for the past couple of months. I have looked at several commercial tools and then found out about VisualVM from the Java Performance book written by Charlie Hunt and Binu John. This book speaks of both JConsole and VisualVM. I started playing around with VisualVM and was amazed with how easy it was to use. I had a remote session up and running with it. Several of the commercial tools I am looking at, I am still trying to setup a remote connection (after days/weeks of conversation back and forth with vendor support).
loading...
loading...